
*To see this with sample code, check out my Kaggle notebook.
Like Simple Linear Regression, multiple regression is a “supervised” “regression” algorithm.

Supervised meaning we use labeled data to train the model.

Regression meaning we predict a numerical value, instead of a “class”.

However, we now have multiple independent variables that impact the dependent variable.


Least Squares is still used, but instead of fitting a line to the data, we fit a (n-1) dimensional plane. (Ex: 3D data -> 2D plane.)

Before applying Multiple Regression, we must test 4 specific assumptions, which can be done with any statistical software.

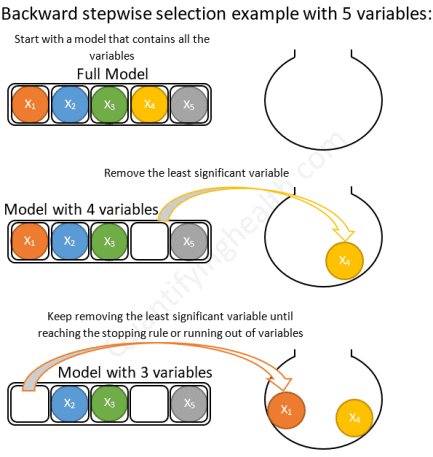
Next, we must select our independent variables; maximizing the accuracy while minimizing the number of variables used. This balance is called “parsimony”.

There are multiple approaches to making this decision, such as “backward elimination” and “forward selection”.

Once we’ve completed the regression, we evaluate the fit with the “R^2 score” which tells us how closely our prediction matched the data.

We use an “F-test” to find the “p-value” which tells us the probability that our observations are due only to chance. Typically, the findings are “significant” if p < 5%.

Overall, Multiple Regression is very applicable to real world problems, however, practitioners must test the assumptions and apply parsimony for valid conclusions to be made.

